According to Kaur and Kamini (2018), “A graphic organizer is the visual or pictorial representation of the knowledge that displays relationship[s] among facts, concepts and ideas” (p. 401). K-12 teachers or college instructors can use graphic organizers to help students organize, classify, and communicate their ideas more effectively. Studies have shown that information presented in a visual-and-text format is easier to remember than in a text-based format alone. Mayer and Clark (2003) called that phenomenon the “multimedia effect (p. 61).”
Types of Graphic Organizers
There are many different types of graphic organizers, and each one serves a specific purpose. Examples include Venn Diagrams, Concept Maps, and Cause and Effect Relationship diagrams.
Venn Diagrams.
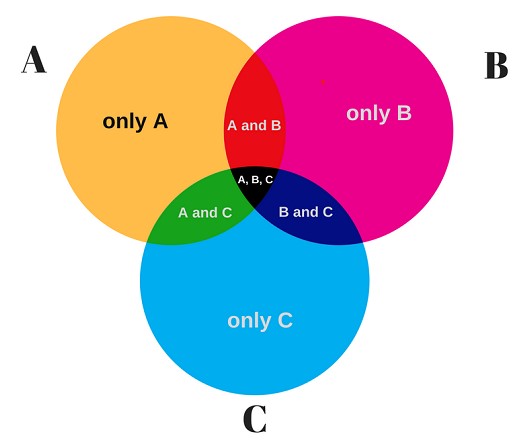
A Venn Diagram is a type of graphic organizer that displays interlocking circles, as shown below.
 Source: https://www.intellspot.com/venn-diagram-examples/
Teachers use Venn diagrams to help students learn how to identify differences and similarities between learning objects. The teacher presents the diagram and asks students to explain how the content in the circles is different in the outer parts of the circles and how it is the same in the shared inner space of the circles.
Concept Maps
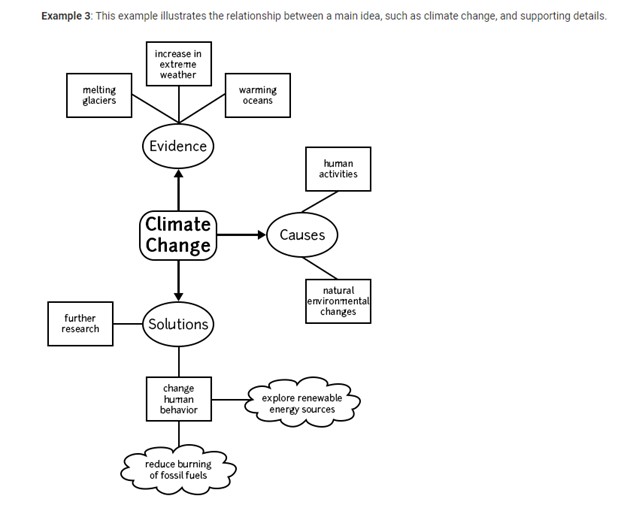
A concept map is a visual representation that appears as a web with arrows connecting each graphic image. This map type helps students identify the main concept and its hierarchical relationships with sub-concepts (The Learning Center, University of North Carolina at Chapel Hill, n.d.).
 Cause and Effect Relationship Diagrams
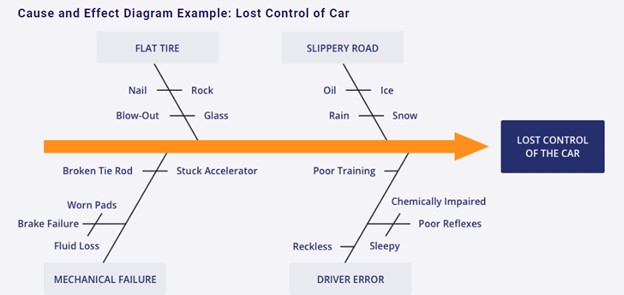
“A cause-effect diagram is a visual tool used to logically organize possible causes for a specific problem or effect by graphically displaying them in increasing detail, suggesting causal relationships among theories” (Juran, n.d., para 1)
 Source: Juran (n.d., para. 5).
References:
